A better approach to EV vs ICE Fuel Cost Analysis
Some of you may have seen a study titled “Real world costs of Fueling EV and ICE vehicles” and I’ve spent a little time with it and I personally think it has some flaws and incorrect assumptions. These flaws are mainly in how the study accounts for time spent on EV charging and how it approaches residential charging vs. commercial charging.
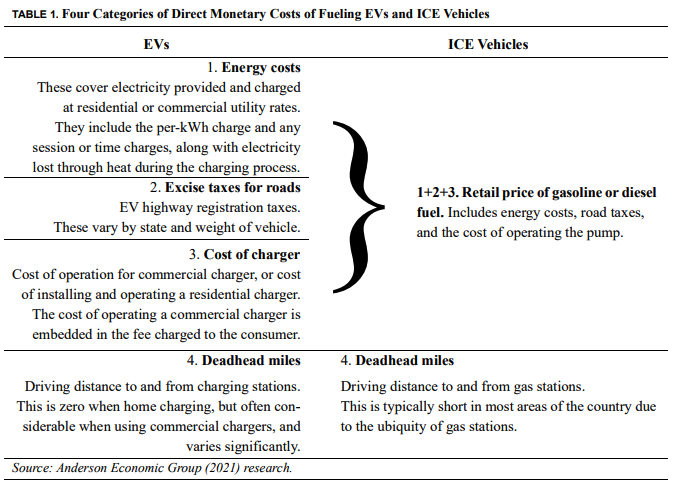
An example of this can be seen in the study’s approach to deadhead miles, seen in the image below:

It correctly highlights that deadhead miles are effectively zero when residential charging but “often considerable when using commercial chargers”. Including “deadhead miles” in any cost category really doesn’t make much sense. Because how many drivers actually take separate trips to fuel their vehicle vs. simply fueling the vehicle along their normal driving route? I would say overwhelming majority fuel their vehicles along their normal driving route, resulting in zero deadhead miles. On the whole, EVs spend much less driver time charging because majority of EV drivers charge at home and it takes about 10 seconds to plug in an EV. Furthermore, including “qualitative” considerations in a “quantitative” study is questionable. Who is the author to assume how drivers want to quantify their time? Stick to hard costs that apply to EVERYONE and let individuals determine how they want to value their own time!
Another flaw in the above analysis would be including the cost of installing an EV charger in the cost analysis. This is an investment in time savings (ie EV drivers with a home charger will save time over ICE drivers and EV drivers who don’t have a home charger) AND an investment in property value. So it makes no sense to include that cost in this analysis.
Aside from some of the flaws I’ve highlighted, I generally find long, wordy studies like this hard for the layperson to simply decipher. Who is really going to read, analyze, and decipher a 75 page report? You either have journalists who just want to create a buzzy headline and don’t read the report or people with pre-determined views just validating those views but not reading the report. I think often time author’s of these reports make them too complicated which allows for incorrect assumptions to creep in. At the same time, this report seems to lack nuance and doesn’t appear to do a good job of comparing multiple scenarios (ie regular vs. premium fueled ICE vehicles, different EV driving scenarios, etc).
KISS = Keep It Simple Stupid (but apply the simple approach to multiple scenarios)
The best way to demonstrate the info the report is attempting to demonstrate is create a clearly laid out and well sourced table, and then put all assumptions/data/analysis in an appendix. This is much clearer and prevents a reports author from obfuscating important data/information. Lucky for you I’ve done that and you can find the link to the interactive table at the end of the post! And get this: If you find flaws, please point them out to me and/or comment below and we’ll update it if it’s the right thing to do!
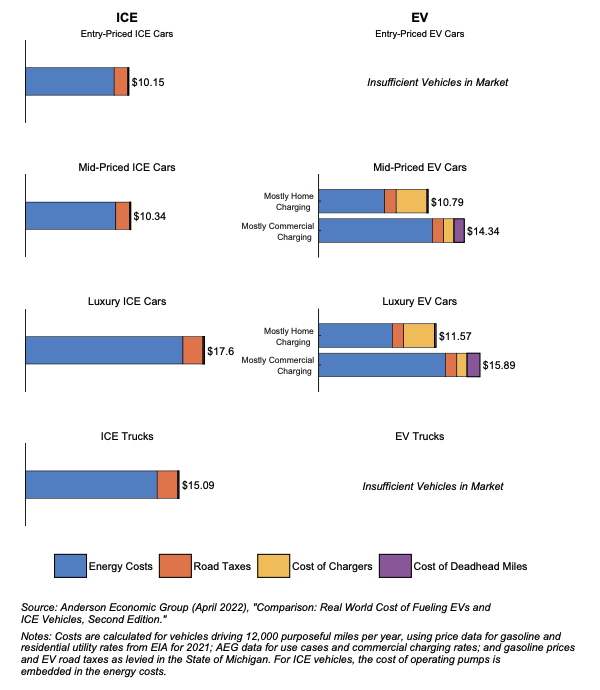
But first, one other item I need to clarify. In the above image there’s one cost bucket for “road taxes” and I had a hard time digging this up for an easy comparison, so I will use the study’s approximate values for these. What you can see below is that EV’s typically have the same or lower road taxes (as seen in the width of the orange bar) so I’m considering this a “wash” in my analysis below:
